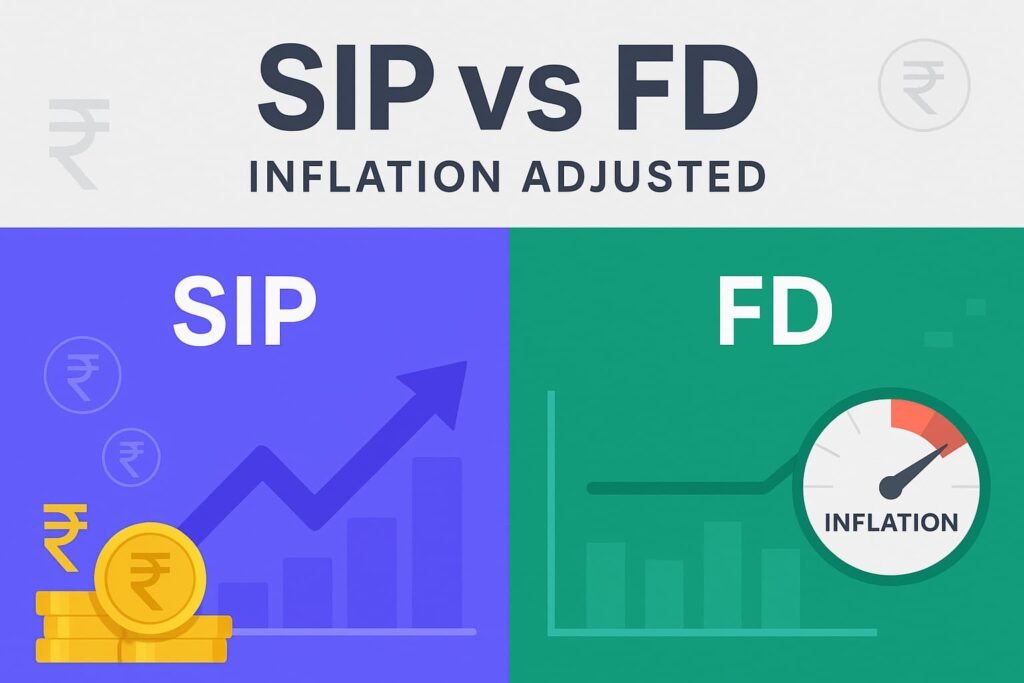
SIP vs FD returns inflation adjusted comparisons aren’t just about which number looks bigger at the end — it’s about knowing what that money will actually buy in the future after inflation and taxes take their share. Inflation slowly eats into your gains, and taxes can shrink them even further, which is why looking at the real, post-tax value gives a much clearer picture. In this guide, we’ll explain how both factors change the outcome, and show you an example you can test in our calculator using your own numbers.
The Problem with Nominal Returns
When you see that a SIP (Systematic Investment Plan) grew at 12% a year or that an FD (Fixed Deposit) gives 6.5% annually, these are nominal returns — the raw growth before you factor in inflation or taxes. They might look good on paper, but the real question is: how much will that money actually buy later?
For example, investing ₹5,000 every month for 10 years in a SIP could grow to about ₹11.6 lakh. Impressive, right? But if inflation averaged 5% during that time, the buying power of that ₹11.6 lakh would feel more like around ₹6.7 lakh in today’s money.
Nominal returns show you a big number, but not its true value. Without adjusting for inflation, you could be overestimating what your future savings can really do for you.
When to Choose SIP vs FD
| Situation / Goal | SIP Advantage | FD Advantage |
|---|---|---|
| Time Horizon | Works best for long-term (5+ years) | Works for short- to medium-term |
| Risk Tolerance | Suitable for moderate-high risk takers | Suitable for low/no-risk preference |
| Inflation Protection | Higher potential to beat inflation | Limited protection |
| Income Needs | Not ideal for fixed income | Ideal for steady interest income |
| Liquidity | Flexible withdrawals (may impact returns) | Penalty for early withdrawal |
| Market Conditions | Can benefit from market growth | Unaffected by market ups/downs |
Inflation Adjustment: Turning Nominal into Real Returns
When comparing SIP vs FD returns inflation adjusted, you’re basically asking, “What is my future money worth in today’s terms?” Inflation adjustment does this by discounting the future value of your investment back to present-day buying power.
The formula is:
Real Value = Future Value ÷ (1 + Inflation Rate) ^ Years
For example:
SIP nominal value after 10 years: ₹11,61,695
Inflation: 5% per year
Real value today: about ₹6,78,697
In simple words, even though your statement shows ₹11.6 lakh, it will feel like only ₹6.7 lakh in today’s market. That’s nearly 42% of your gains gone — not because of bad investing, but because prices around you went up. This is why looking at inflation-adjusted numbers is key to making smarter investment choices.
The Tax Factor: Quiet but Costly
When comparing SIP vs FD returns inflation adjusted, taxes are the other silent killer of returns. For FD investors, interest earned is taxed at your income slab rate. If you’re in the 30% bracket, that “6.5%” FD might actually give you only about 4.5% after tax — and that’s before inflation chips away at it even more.
SIPs (through mutual funds) work differently:
Equity funds: Long-term capital gains (after 1 year) are taxed at 10% above ₹1 lakh in gains.
Debt funds: Gains are taxed at your slab rate if held for less than 3 years, or at 20% with indexation benefits if held longer.
For example, if you made ₹2 lakh in FD interest, a 30% tax rate would take ₹60,000 — instantly lowering your effective return. The same investment in an equity SIP might lose far less to taxes, depending on your gains and holding period.
The fairest way to compare SIP and FD is to apply the same assumed tax rate in the model. This way you see the pure impact of compounding, inflation, and investment type — without letting tax complexity skew the picture.
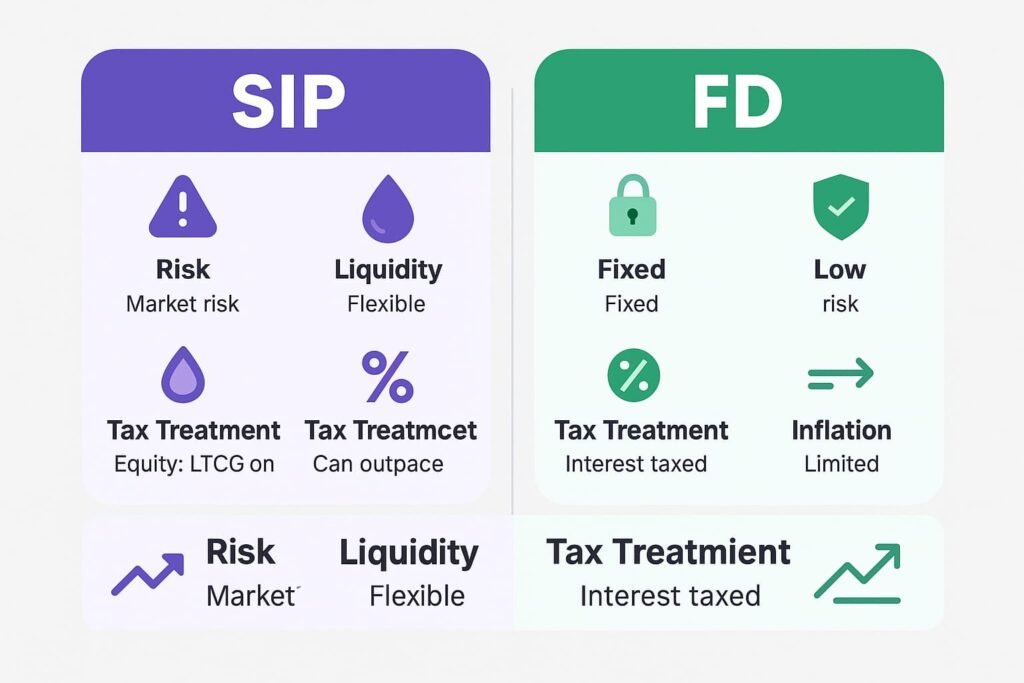
SIP vs FD Quick Comparison (Inflation‑Adjusted Perspective)
| Factor | SIP (Systematic Investment Plan) | FD (Fixed Deposit) |
|---|---|---|
| Return Type | Market‑linked, can vary (e.g., ~8–15% historically for equity SIPs) | Fixed rate (e.g., 5–7% depending on bank & tenure) |
| Tax Treatment | Equity: LTCG @10% above ₹1 lakh after 1 year; Debt: slab rate (short term) or 20% with indexation (long term) | Interest fully taxable at your income slab rate |
| Inflation Impact | Potential to beat inflation over long term, but no guarantee | Often fails to beat inflation after tax |
| Risk Level | Market risk — value can fluctuate | Low risk — principal guaranteed by bank |
| Liquidity | Redeem anytime (may affect returns) | Premature withdrawal penalties apply |
| Best For | Long‑term wealth creation, beating inflation | Short‑term safety, fixed income needs |
|
Example 10‑Year Real Value (₹5,000/month, 12% SIP, 6.5% FD, 5% inflation, 10% tax) | ₹6.78 lakh (inflation‑adjusted) | ₹5.04 lakh (inflation‑adjusted) |

SIP vs FD: A Fair Comparison Method
If you really want to judge SIP vs FD returns inflation adjusted, the comparison has to be fair from the start. That means lining up both investments on the same terms so you’re not comparing apples to oranges.
Match the investment pattern – If you’re doing a monthly SIP, compare it to an FD with monthly deposits (like a recurring deposit), not to a single lump sum FD. And if you’re doing a one-time lump sum, compare both as lump sum. This keeps the cash flow and compounding pattern the same.
Apply the same tax rate – Pick a realistic rate for your income bracket so both investments are treated equally after tax. This way, the difference you see is due to the investment’s growth, not just how it’s taxed.
Discount for inflation – Use the same inflation rate for both so you can see the real purchasing power. Without this step, a higher “nominal” return might look better than it really is.
By keeping the rules equal for both SIP and FD, you’ll get a true picture of which option works harder for your money in real terms.
Example Calculation
To see how SIP vs FD returns inflation adjusted really play out, let’s compare a 10-year plan where you invest ₹5,000 every month in both options.
Assumptions:
SIP return: 12% per year
FD interest rate: 6.5% per year
Inflation: 5% per year
Tax rate: 10%
Results (rounded):
SIP nominal value: ₹11,61,695
SIP post-tax value: ₹11,05,526
SIP real (inflation-adjusted): ₹6,78,697
FD nominal value: ₹8,46,577
FD post-tax value: ₹8,21,919
FD real (inflation-adjusted): ₹5,04,587
That’s a real-term difference of about ₹1.74 lakh in purchasing power — meaning the SIP could buy you more goods and services in the future compared to the FD, even after considering both taxes and inflation.
Put simply, while the nominal numbers might look close, the inflation-adjusted view shows that SIP makes your money work harder over the long term in this example. Of course, market risk for SIPs is higher, so the right choice depends on your comfort with risk and investment goals.
Nominal vs Post-Tax vs Inflation-Adjusted
| Investment Type | Nominal Future Value | Post-Tax Value | Inflation-Adjusted Value |
|---|---|---|---|
| SIP | ₹11,61,695 | ₹11,05,526 | ₹6,78,697 |
| FD | ₹8,46,577 | ₹8,21,919 | ₹5,04,587 |
What This Means for Investors
The numbers above show why looking at SIP vs FD returns inflation adjusted gives a more honest picture of your money’s future value. It doesn’t mean SIP will always be the winner — it means that if your goal is to protect and grow your purchasing power, you need to:
Beat inflation after tax – Make sure your returns are higher than inflation once taxes are deducted, otherwise your money is slowly losing value.
Match the investment pattern to your goal – Long-term wealth building? SIPs may suit you better. Short-term fixed goals? FDs might be safer.
Understand the trade-offs – SIPs have market ups and downs; FDs offer stability but usually lower real returns.
If you need steady income, have a short time frame, or simply want peace of mind, FDs could still be the right fit even if the real returns are smaller. For longer horizons and growth potential, SIPs can help your money work harder — as long as you’re comfortable with some risk.
Why This Approach Supports Better Financial Decisions
Most articles about SIP vs FD only talk about the headline percentage or the final big number — but that can trick you into thinking a higher percentage automatically means a better investment. In reality, without adjusting for inflation and taxes, those figures don’t tell you what your money will truly buy in the future.
By using the SIP vs FD returns inflation adjusted approach, you’re looking at actual spendable value, not just an inflated figure on paper. This is exactly how experienced financial planners assess options, because it shows the real impact on your future lifestyle. And with our calculator, you don’t have to wrestle with formulas — you can see the results instantly for your own numbers.
Inflation and taxes are like silent partners in every investment — always taking their cut, whether you notice or not. If you only look at nominal returns, you’re missing the most important part of the story: what your money will really be worth when you need it.
By using the SIP vs FD returns inflation adjusted approach, you’re not just chasing a big number on paper — you’re making decisions with a clear view of your future purchasing power. That’s the difference between investing blindly and investing with your eyes wide open.
Disclaimer: This content is for educational purposes only and does not constitute financial advice. Investment returns can vary depending on market conditions, interest rates, and personal factors. Always consult a qualified financial advisor before making any investment decisions.
About Seva Funds & Important Disclosures
About the Author
Prashant SN
Education: MCom (Master of Commerce)
What I enjoy: Finance calculations and building easy tools for everyday decisions
Hi, I am Prashant SN. I studied MCom and I am interested in finance calculation. I started Seva Funds to share clean, fast calculators and no-nonsense explanations for India.
Disclaimer
This website and its content are for informational and educational purposes only. It is not intended to be and does not constitute financial, legal, or any other type of professional advice. We do not guarantee the accuracy, completeness, or usefulness of any information on the site. Always consult with a qualified financial professional before making any financial decisions.
🔗 More From SevaFunds
- Disadvantages of Scientific Calculators Over-reliance, concept gaps, exam pitfalls, and better study habits.
- Tea Seller Budget Blueprint Daily-to-monthly costs, margins, break-even math, and cash-flow tips.
- Petrol Tax in India: Monthly & Yearly Cost (2025) Base price, excise, VAT, dealer commission—simple breakdown & examples.


